Vega.js is a declarative grammar for defining interactive visualizations that can be embedded on the web. It’s a great alternative to writing visualizations “by hand” using D3 or vanilla JavaScript. In this video, I walk through how to create a Vega.js visualization from scratch, including leveraging the documentation and incorporating interactivity.
Why Declarative Visualization?
Most people that start with visualization on the web either turn to pre-packaged charting solutions like Highcharts or to more imperative approaches like using D3 to create a graph.
Pre-packaged solutions like Highcharts are great because they make it easy to quickly generate a standard chart. These packages have functions corresponding with chart types. You want a bar chart? Pick the bar chart function and provide some options to configure it. While the ease of use is great in this scenario, the flexibility is limited. By organizing into chart types, you are limited to representing your data in the forms most commonly used in visualization. You are also limited in how you can tweak those forms based on the configuration settings that the library provides.
Solutions like D3 on the other hand provide ultimately flexibility. D3 as an example has no concept of a chart type. Rather, it provides tools and building blocks for assembling any kind of data-based graphic. This flexibility comes with a cost: it’s much more work to create an interactive graphic because you are responsible for wiring up all the pieces that will form the chart.
What can we do if we want the flexibility of a low level approach like D3, but the speed and ease of use of a higher level abstraction like Highcharts? The answer is declarative visualization, which sits between these two approaches on the abstraction ladder.
In declarative visualization, you provide a description of the graphic that you want. This description does not correspond with a chart type; rather, you describe the various entities that should make up the chart and the relationships between those entities. These entities might include:
- What data does your chart have?
- Does it have axes and legends? Where should they be placed?
- What kind of shapes are shown in your graph? How do they link to the data?
By providing a description of the pieces of a graphic, you get closer to the flexibility that D3 has. At the same time, since you are unconcerned with how those pieces get wired together, you get closer to the speed and ease of use that charting libraries have. This is ultimately what it means to be declarative: describing what your chart should show, not how it should be created.
Declarative visualization doesn’t have to be limited to just what a chart produces graphically. As Vega’s signals have shown, you can use a declarative approach to describe complex interactions as well. Take this example from Vega’s website:
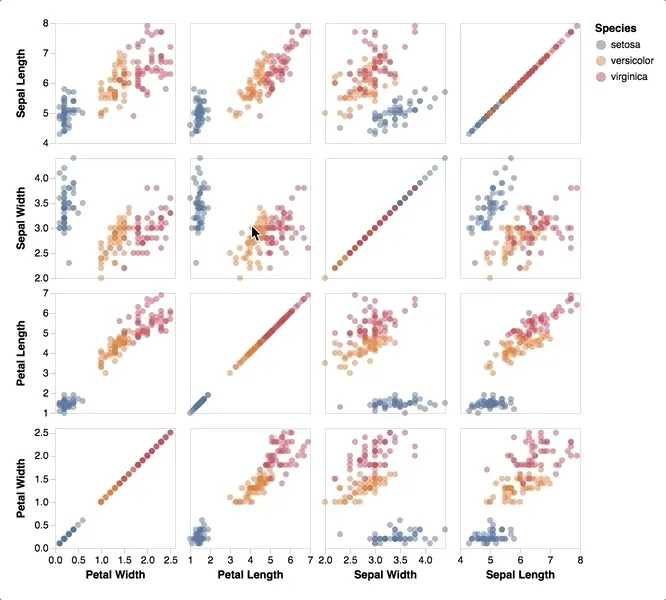
This visualization is defined with a spec that is only 340 lines long!. Better yet, to modify this visualization, all you have to do is change various parts of the spec. A few simple modifications to this spec can produce wildly different results.
This is the power of declarative visualization: the ability to define custom visualizations with great flexibility and minimal overhead.
Other Declarative Visualization Libraries
Vega.js is not the only tool out there for declarative visualization. You may also want to check out one of the following:
- piccaso.js: a declarative visualization framework from Qlik. It has great support for responsive design. While it’s data source agnostic, if you are coming from a Qlik background it has some nice plugins to integrate with the Qlik engine.
- eCharts: a little more tightly aligned with chart types but still provides significant flexibility. It has WebGL rendering capabilities for 3D visualizations and maps.
- vega-lite: from the creators of Vega, this is a wrapper around vega to greatly simplify use at the cost of some of the flexibility. It’s still remarkably flexible and a good starting point if Vega’s detailed spec seems too overwhelming.