While my life these days tends to center around Qlik Sense and it’s APIs, occasionally QlikView pops its head back into the picture.
At Axis Group, we employ UX designers with a specialization in data visualization that work with users to understand their challenges and then produce designs for dashboards that can best help them address their problems. While these designers try to stay within the constraints of whatever technology will be used for implementation, sometimes they create a chart that is just on the fringes of feasibility.
I received an email on such a chart the other day that needed to be implemented in QlikView. The design showed this chart:
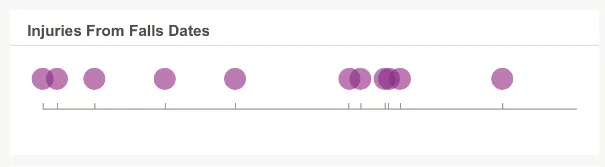
The chart plots events that happen over time in a dot plot. The part that the developer was unsure about was the markers on the x-axis. The question was, could we produce this design pixel perfect in QlikView?
After some exploration, the answer turns out to be yes. We used a combo chart to produce the dots, which gave us access to an additional feature: error bars. In QlikView, error bars can be defined with a central point and a line above and below that central point. They look like a capital serif “I”:
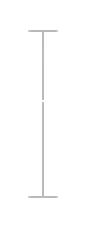
In our scenario, we want to use the middle part of the error lines while hiding the ends to produce the effect of a marker on the axis. So how to hide the ends?
The bottom end of the error bar can be hidden by placing it directly on top of the x-axis and matching the colors so that it blends into the axis. This overlay gives the illusion that the error bar is protruding from the x-axis. We use a static y-axis min to match the static value we set for our error bar bottom so that they always match.
That leaves the top of the error bar. This piece can be hidden with a well-placed reference line. We create a reference line that is white to match the chart background and place it at the same location at the top of the error bars, which covers them.
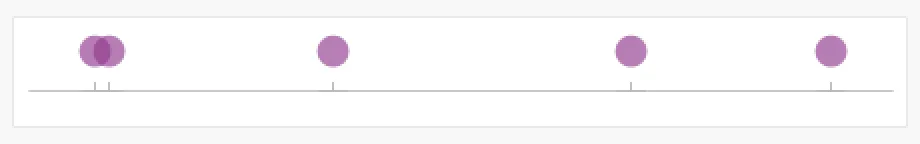
What’s remaining is the middle of the error bar. After setting the y-axis min and max to match the spacing we want and hiding elements we don’t need like the y-axis and legend, we get the following:
There are a number of creative uses for error bars that you can leverage in QlikView to make some unique chart forms that don’t come out of the box. Check out the QVW to play more with this example.