Mark Raasveldt recently shared a post about Correlated Subqueries and their performance in DuckDB. As he states in his post,
Subqueries in SQL are a powerful abstraction that allow simple queries to be used as composable building blocks. They allow you to break down complex problems into smaller parts, and subsequently make it easier to write, understand and maintain large and complex queries.
I want to show a couple of real world use cases where correlated subqueries are useful for analyzing business data. In this first post, let’s look at a scenario involving deduplicating data.
Scenario 1: Aggregating data in an OBT at different granularities
I work on an analytics product called Rill that leverages a One Big Table (OBT) architecture for it’s data models. As the name suggests, with OBT we load all of our data to be analyzed into a single table, as opposed to using multiple tables in a star or snowflake schema. The benefits of using OBT are that the model becomes simpler, and common types of data analysis operations like filtering and aggregation become faster and more scalable. However, using an OBT presents challenges as well.
One such challenge is that our data is modeled at a single level of granularity. Let’s say we have some Sales data, with an OBT structure that shows me a list of orders, the order year, the sales amount, and the salesperson:
| OrderId | OrderYear | SalesAmount | Salesperson |
|---|---|---|---|
| 1 | 2020 | 100 | Beth |
| 2 | 2021 | 50 | Beth |
| 3 | 2021 | 20 | Beth |
| 4 | 2022 | 10 | Beth |
| 5 | 2021 | 80 | John |
| 6 | 2021 | 20 | John |
| 7 | 2022 | 40 | John |
In this table, our lowest granularity is OrderId, with the associated SalesAmount. This works well for doing calculations on the SalesAmount. We can:
- Get the total sum of Sales:
sum(SalesAmount) - Get the total sales amount per salesperson:
sum(SalesAmount) group by Salesperson - Get the total sales amount per year:
sum(SalesAmount) group by Year
However, what if we add a new measure that doesn’t match this level of granularity? For example, lets say that each salesperson has a salary every year. We define the Salary at the Salesperson level:
| Salesperson | Year | Salary |
|---|---|---|
| Beth | 2020 | 100 |
| Beth | 2021 | 100 |
| Beth | 2022 | 120 |
| John | 2021 | 80 |
| John | 2022 | 90 |
When modeling data into an OBT, this Salary data will frequently get duplicated across all records, resulting in the following data:
| OrderId | OrderYear | SalesAmount | Salesperson | Salary |
|---|---|---|---|---|
| 1 | 2020 | 100 | Beth | 100 |
| 2 | 2021 | 50 | Beth | 100 |
| 3 | 2021 | 20 | Beth | 100 |
| 4 | 2022 | 10 | Beth | 120 |
| 5 | 2021 | 80 | John | 80 |
| 6 | 2021 | 20 | John | 80 |
| 7 | 2022 | 40 | John | 90 |
This duplication of records happens due to the mismatching granularities between SalesAmount (OrderId level) and Salary (Salesperson and OrderYear level). This prevents us from getting some pretty basic answers from our OBT with a total salary metric, like:
-
What is the total salary that we have paid the sales staff?
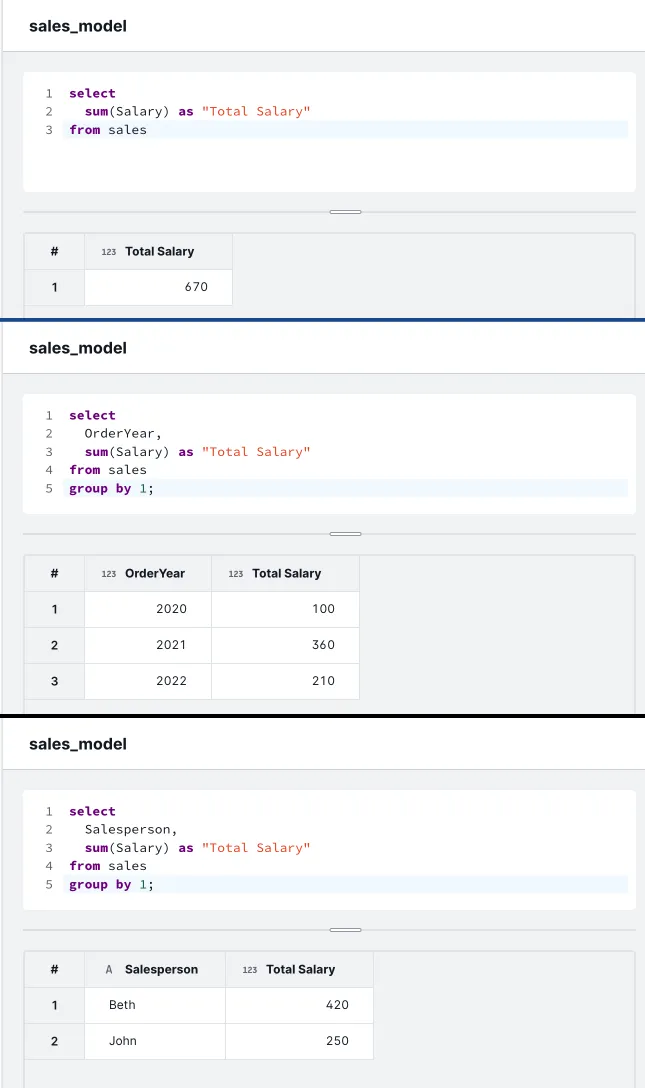
sum(Salary)= 670 ❌ -
What is the total salary that we pay staff each year?
sum(Salary) by OrderYear❌ -
What is the total salary just by Salesperson?
sum(Salary) by Salesperson❌
In Rill, users define a SQL expression for a metric in a dashboard YAML config file. That expression is then injected into SQL queries for calculating KPIs, trends, and dimension leaderboards. Therefore, we need a single expression for total salary that will properly deduplicate our Salary column by Salesperson when calculating any kind of aggregate over our OBT. In other words, our measure expression needs to work when injected into queries like:
- Total Salary:
select <MEASURE EXPRESSION> as "Total Salary" from Sales - Total Salary by Year:
select OrderYear, <MEASURE EXPRESSION> as "Total Salary" from Sales group by 1 - Total Salary by Salesperson:
select Salesperson, <MEASURE EXPRESSION> as "Total Salary" from Sales group by 1 - Total Salary for Beth:
select Salesperson, <MEASURE EXPRESSION> as "Total Salary" from Sales where Salesperson = 'Beth' group by 1
Enter correlated subqueries. Rill is powered by DuckDB, so we can take advantage of it’s correlated subquery performance to solve this problem. With a correlated subquery, we can write a query as our measure expression. We can borrow a trick found in Malloy for doing this deduping. In our query, we first use a list aggregation function to collect all of our distinct Salaries by OrderYear and Salesperson:
list(distinct { key: concat(Salesperson,'~',OrderYear), val: Salary})Then, we can use unnest to expand that list into a table of values that can be selected from:
select unnest(list(...)) inner;Finally, we can run our sum aggregation step over that inner table of deduped records:
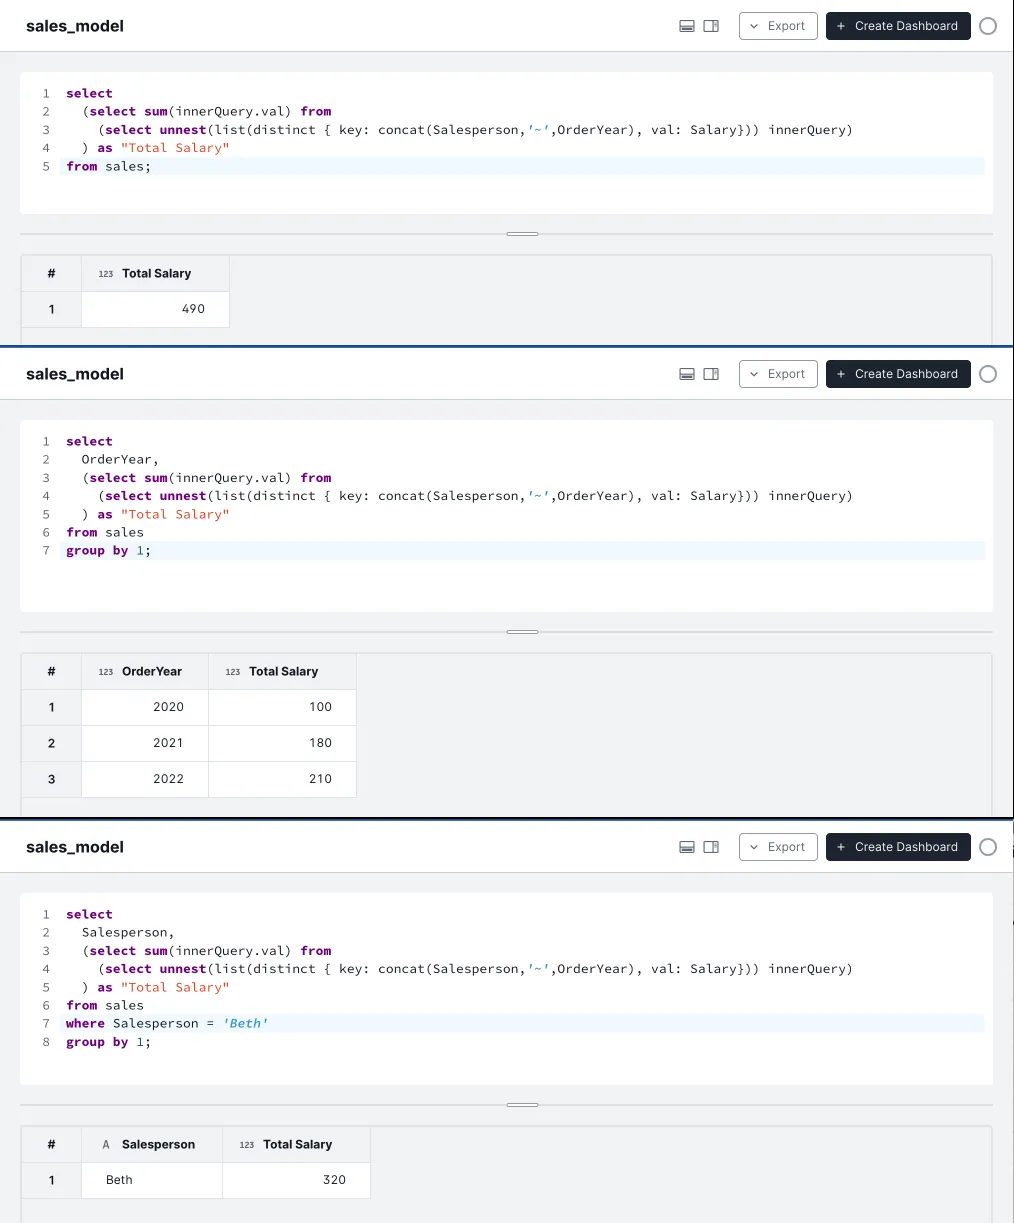
select sum(inner.val) from (select unnest(list(...)) inner);That entire query statement can be used as a measure expression, resulting in this measure expression:
(select sum(inner.val) from
  (select unnest(list(distinct { key: concat(Salesperson,'~',OrderYear), val: Salary})) inner)
) as "Total Salary"
If we try this expression in various query contexts with different aggregations and filters, we will see it consistently gives us the correct answer we were looking for:

Thats it for this scenario; in Pt 2, I will show how to write a measure expression that accumulates over a timestamp column using a correlated subquery that can be reused across aggregation contexts.